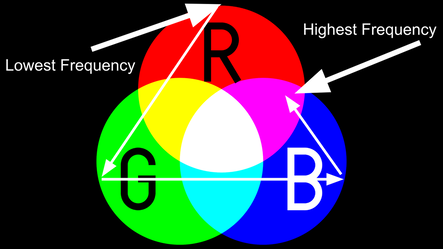
Our Goal
In terms of melody detection, our goal has been to track the main melody of the music by mapping the fundamental frequency to the color spectrum and having that change in time with the music. As the vocalist sings higher or lower this will be represented by having more red or more blue in the color. While we were able to develop a tentative relationship between frequency and color values, there is still room for further improvement and integration.
Initial Attempt
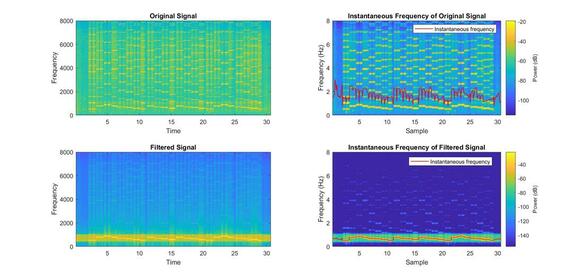
First, we chose to plot the spectrogram of Twinkle Twinkle Little Star because it has a simple melody and will thus be easier to analyze. Because the melody is played on a harmonica, there are many harmonics included in the signal. This complexity weakens the effectiveness of our instantaneous frequency detection function, instfreq(). In an attempt to make the melody easier to distinguish, we pass the signal through a bandpass filter to isolate the primary frequencies. As you can see below, the detected instantaneous frequency plot is significantly smoother and more accurate than the unfiltered version. We can then use these results to map the frequencies to our LED strip.
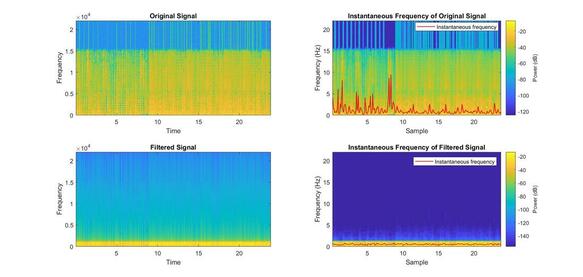
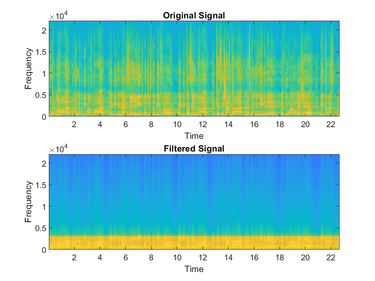
Applying this method to our second song, Love Game, was a more difficult process. The song contains many synthesized elements occurring simultaneously, so it is much harder to pick a filter to distinguish the melody from the rest of the song. Because the human ear can best detect frequencies from 1000 Hz to 5000 Hz, we are hoping to create a bandpass filter that will allow these frequencies past, which will hopefully be accurate enough for our instantaneous frequency function to decipher the instantaneous frequencies. Pictured beside is the spectrogram of the unfiltered song, along with its detected instantaneous frequencies.
Extraction Process
1. Bandpass Filter
|
Using the raw input from the signal results in frequencies that are outside of our region of interest. In order to make the note detection more accurate, we used a bandpass filter from 100 Hz to 3000 Hz to encompass the bulk of the human vocal range.
|
|
2. Instantaneous Frequency
|
Next we computed the instantaneous frequency at each point in time to approximate the fundamental frequency at that sample. This step is more accurate for simpler songs and tends to be much more inaccurate when other elements are introduced.
|
|
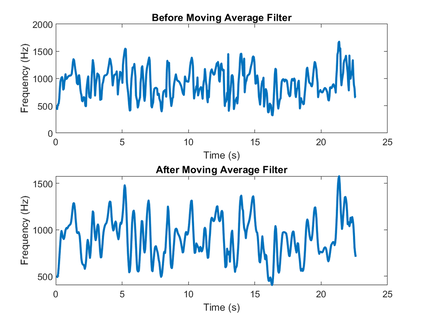
3. Moving Average Filter
|
After obtaining the estimate for instantaneous frequency the values are a little erratic. In order to smoothly transition between color on our LED strip we need the frequencies to be more stable, thus we use a moving average filter to even out the values a little. The larger the filter the more smooth the transitions are, however in return we are losing some of the higher and lower frequency values, and thus the note detection accuracy.
|
|
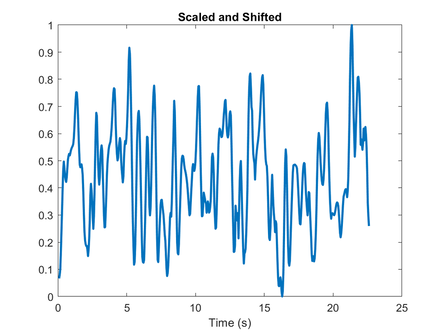
4. Normalization
|
As an input to the Arduino we need the values scaled to something that the serial can interpret, thus we subtract off the minimum frequency value, and then scale the entire plot down to values between zero and one.
|
|
5. Color Setting
|
In order to map the frequencies to color we need a R, G, and B value for each point in time. Our algorithm sets the RGB values based off of what the scaled frequency input is.
|
|
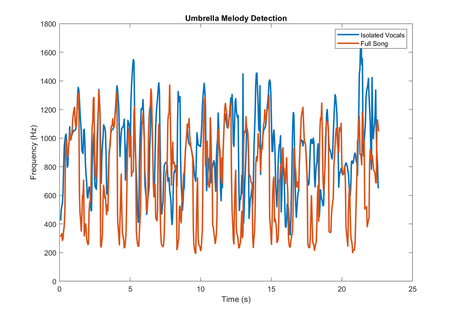
Detection from Vocal Stems
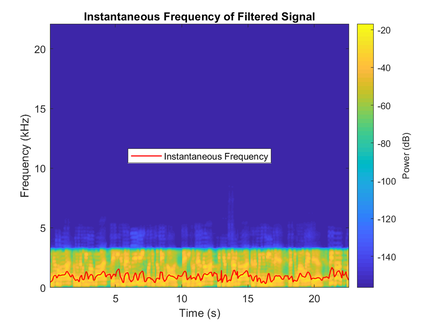
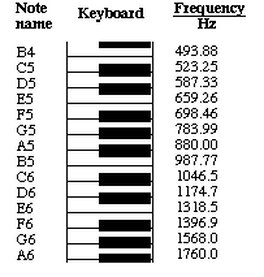
Because of the various overlapping instruments at the same frequency and stronger harmonics from other parts, we decided to extract the melody from only the vocal stem of the song. As you can see in the plot, the isolated vocals do a better job at finding the rises in pitch, and is a little worse at the pauses between note, which are the lower frequencies. The lower frequency values do not matter as much because we don't need to know the note if there is a pause, the high values on the other hand are much more important because they are indicating what the note is. In order to test the accuracy of our algorithm we physically read off frequency values and found the corresponding note, from there we compared the notes to actual sheet music for the song and found that the method was relatively accurate. There were definitely many incorrect notes, but the general trend was correct, and for the sake of showing frequency as color, then the visual would transition accurately.
|
|
Plotting Melody to LED Strip
Ideally the strip would read in our R,G, and B values and then set the color accordingly, unfortunately this was not the case. So, as another form of visualization, we went the LED strip the relative frequency value and had the intensity of the light match the value of the frequency. Visually, higher notes were brighter, while the low notes were dim.
