Our Goal
From the beginning of our project's conception, our main goal has been to implement our system with pop/dance songs. Because these songs have distinct beats we decided that the first step in implementation would be to extract the beat from a song and map it to the brightness of the LED strip. The lights would be constantly flashing along to the beat, and as the beat signal got stronger, the entire LED strip would flash brighter. This was our initial idea, but we ran into a couple issues along the way. Our experience is described below.
Initial Attempt
|
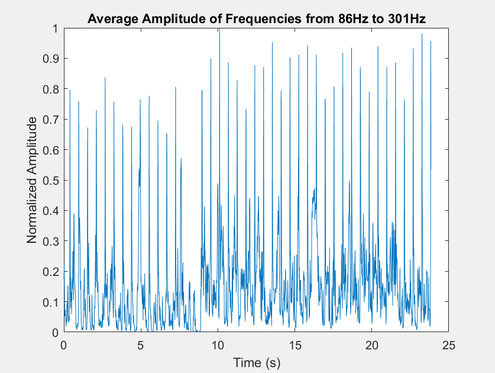
Our main goal for this project is to implement the LED strip for pop/dance songs. While looking at these songs, we noticed that at low frequencies there was a distinct beat that could be seen when plotting the amplitude of the Fourier coefficients of the original signal. Below is the plot of the average value of the Fourier coefficients covering the range of frequencies from 86 Hz to 301 Hz from the song Love Game. As you can see, there is a distinct beat that we could map to the brightness of the LED strip., however there still seems to be a decent amount of noise on the lower half of the plot.
|
This method, however, does not work as well with other songs. For example, we applied the same method to the song Thank U, Next and found slightly different results. Rather than seeing distinct vertical lines, the amplitude is smoother and exists mostly below half of the maximum amplitude. Because this method produced such inconsistent results from song to song, we decided to look for a more consistent method. 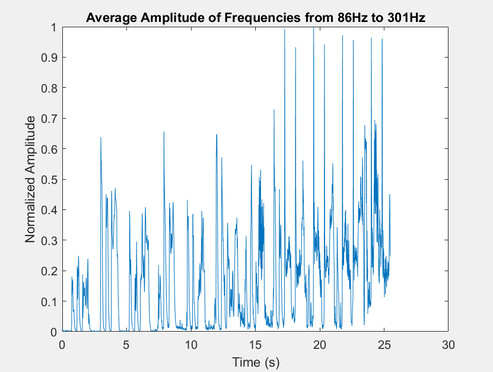
|
Novelty Curve
|
While researching methods for detecting the beat of a song, we discovered the novelty curve. The novelty curve is a plot that detects distinct structural changes in a song by utilizing several digital signal processing techniques which will be discussed below.
1. Bandpass Filter The first step in implementing our novelty curve was to send the original song through a bandpass filter. In our initial attempt of beat detection we discovered that the songs that we want to implement our project on all have a distinct beat at low frequencies. We want our method of beat detection to be as accurate as possible, so we decided to initially filter our songs from frequencies of 80 Hz to 250 Hz as the human voice cannot reach that low so we would just be detecting the bass instruments. 2. Spectrogram We then created a spectrogram from our new filtered signal. Bandpass filtering seemed to be successful in producing a spectrogram with distinct changes. The spectrogram for the song Cut to the Feeling can be seen below. 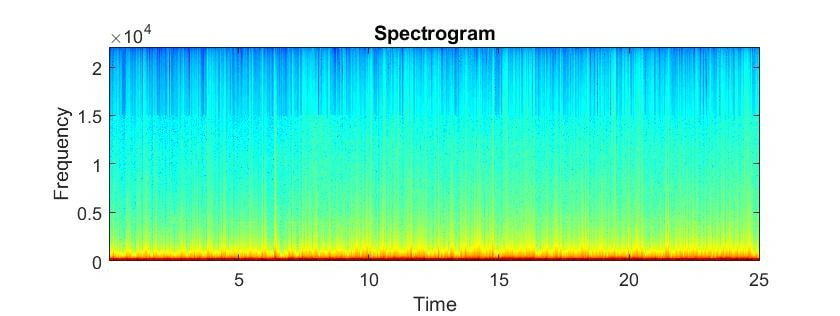
3. Horizontal Differentiation
Now that we have a spectrogram of our song, we want to detect the onset of each beat. In order to do this, we need to take the discrete derivative of our signal along the time axis. By differentiating along the time axis for each frequency component, we will be able to detect any large changes in the overall signal, which will correspond to the beat. Because we are only interested in energy increases in the signal, we will only take the positive difference values, and set all other values to zero. 4. Vertical Accumulation
Now that we have a two dimensional plot of the positive discrete derivative values for each frequency component, we can sum up each column in order to produce a plot that contains single positive values for each point in time that represent the overall positive energy changes at that time. This produces the novelty curve plot pictured below. While this method greatly increases the accuracy of our beat detection, the plot still contains quite a bit of noise that we can filter out. 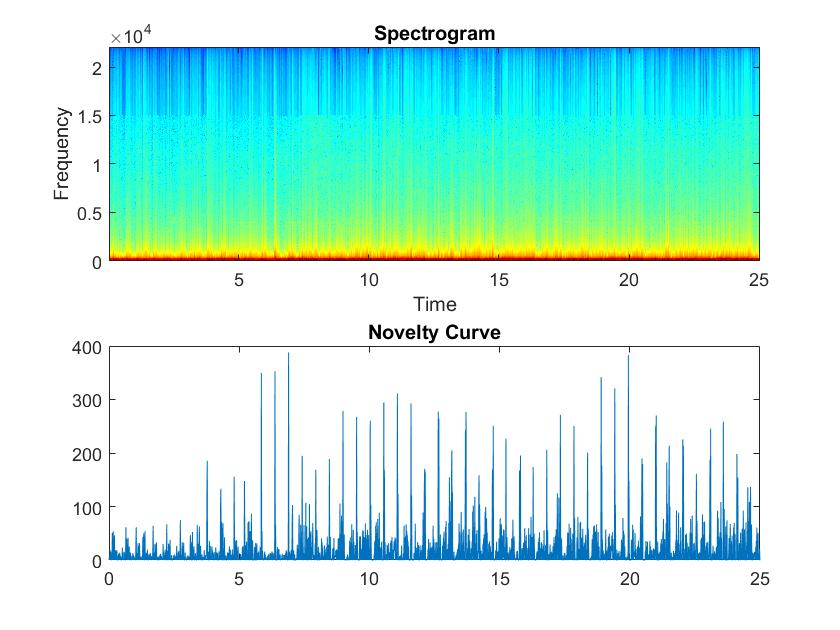
5. Normalization
The final step in constructing our initial novelty curve was to normalize the curve. We intend to implement this method on multiple songs, so in order to create an algorithm that is reproducible, we need to normalize the plot. 
|
Denoising the Novelty CurveBecause the novelty curve produced from the previous steps contained quite a bit of noise, we decided to implement some denoising methods to get a cleaner signal.
1. Moving Average Filter Because a lot of the noise occurs in the lower half of the plot, we decided to subtract the moving average of the novelty curve from the original novelty curve to reduce this noise. We chose the moving average filter for this step because in most applications, the moving average filter is good at filtering out "random" noise from signals while still retaining sharp changes in the signal. As can be seen in the plots below, we experimented with the window size of the moving average filter and found that the larger then window, the better the moving average filter was at filtering out low amplitude noise. When the window increased above 51, however, we noticed that the computation time started to increase noticeably and we were beginning to lose some important peaks, so we decided that a window size of 51 was ideal. As can be seen in the plot below, however, even after passing the novelty curve through a moving average subtracting filter, there is still a decent amount of noise on the lower half of the graph. 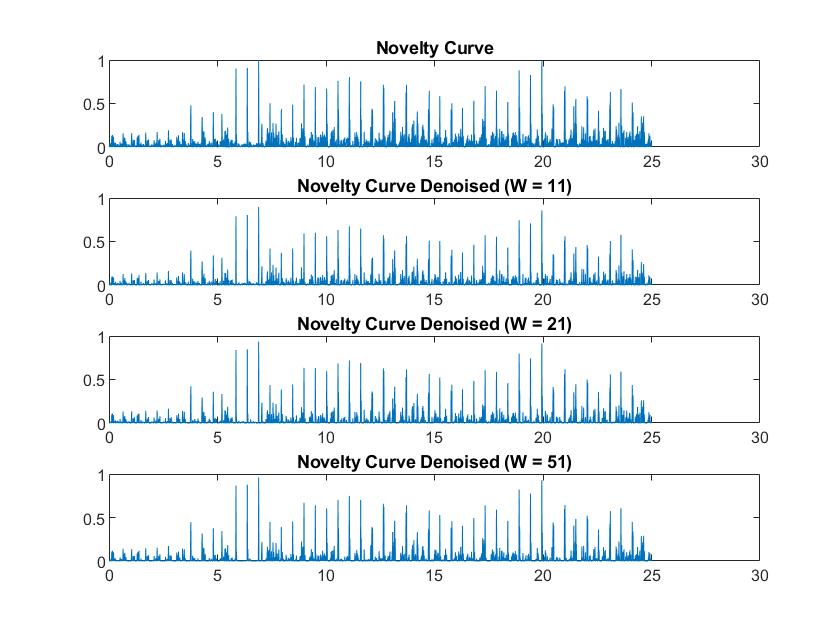
2. Amplitude Threshold
Another method that we utilized for denoising was to threshold the amplitudes on the novelty curve. If the amplitudes fell below a certain value, we would set its value on the new novelty curve to zero. As can be seen below, we experimented with several threshold values and found that a threshold around 0.375 was the best at filtering out lower amplitude noise. When applying this method to other songs, we found that a threshold value of 0.30 was the most consistent at filtering out unwanted noise and not deleting important values. As can be seen in the plots below, however, there are a few instances of two beats occurring very quickly after another which would cause unwanted behavior. The threshold is unable to select one out from the pair if the amplitudes are very close. 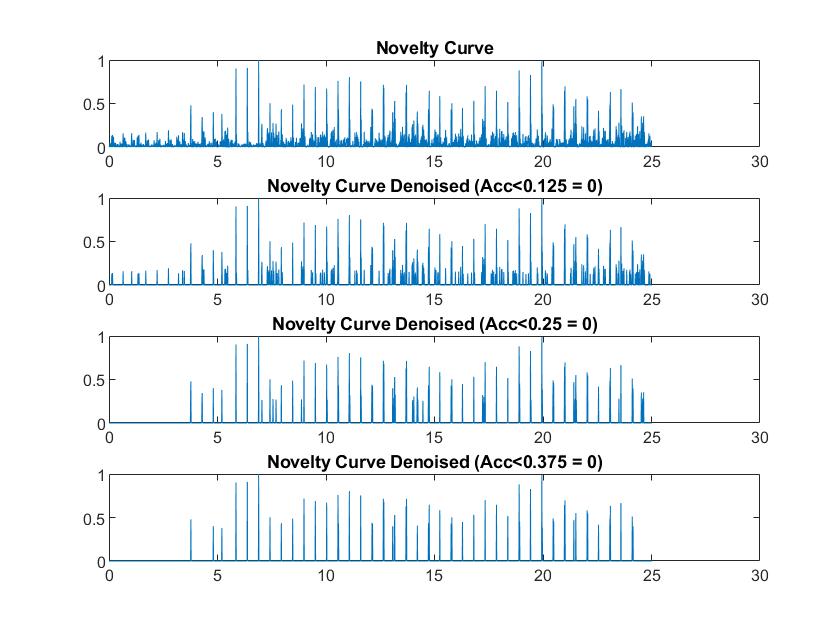
2. Moving Average Filter and Amplitude Threshold
In order to construct the best algorithm for filtering out lower amplitude noise from the novelty curve, we decided to implement both the moving average filter subtraction and the amplitude threshold. We decided to use a moving average window of 51 and a threshold of 0.30 because we were able to get the most consistent results. 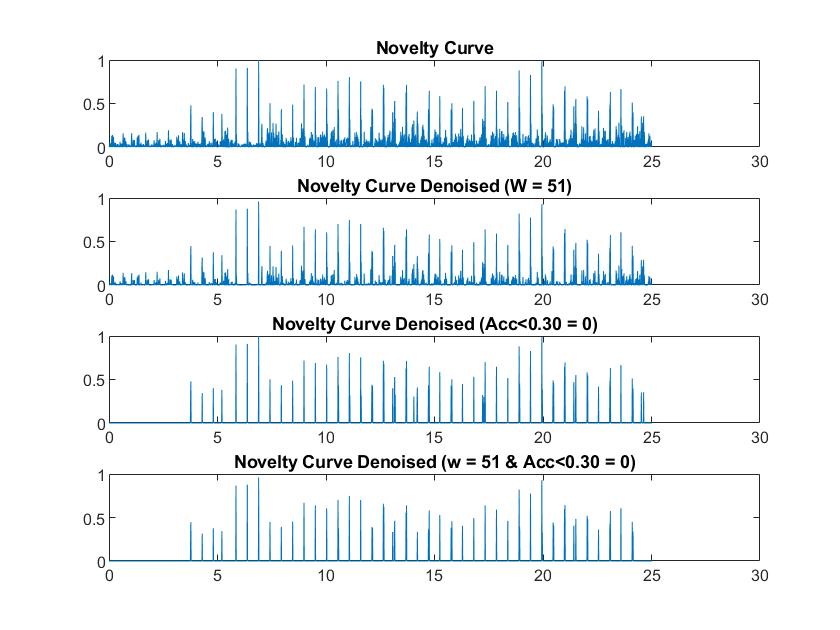
|
Plotting Beat to LED Strip
|
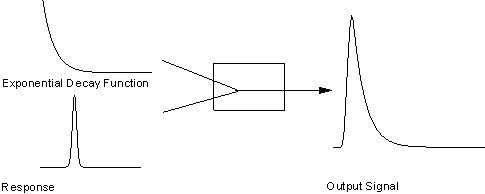
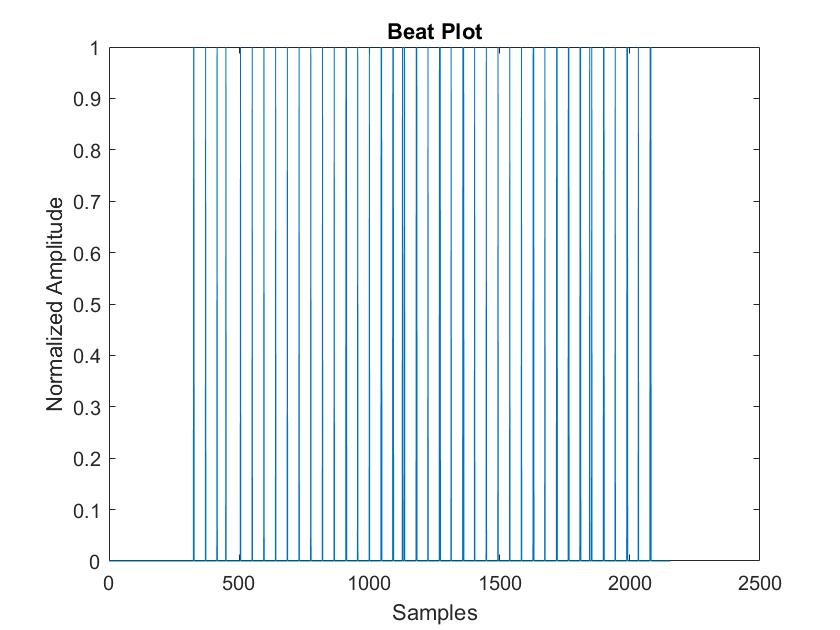
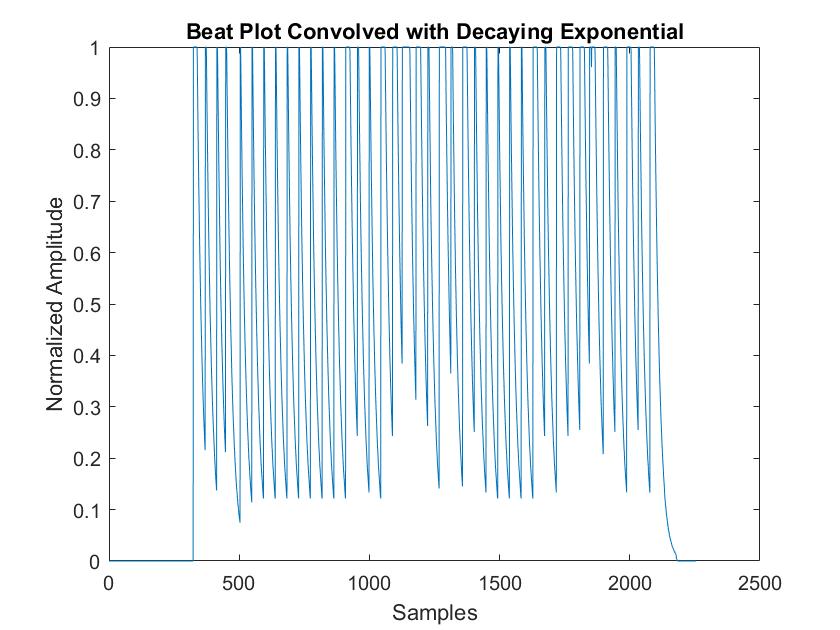
In order to plot the beat of the song to the LED strip, our initial idea was to change the intensity of the LEDs based on when the onset of each beat occurs. In order to do this, we decided to normalize each beat so that some beats weren't brighter than others. We did this by setting each positive value from the novelty curve to one. This produced the plot seen to the right which looks similar to a train of deltas. We attempted sending this to the LED strip, however, we noticed that because each peak only contains one data point and the LEDs are updating about once every hundredth of a second, the beat was not visible on the LEDs. We decided then to rethink how we were plotting the beat to the LED strip. In order to produce a bright flash on the onset of the beat and a slow decay to zero afterwards, we decided to convolve the normalized novelty curve with a decaying exponential function. Because our normalized novelty curve signal is similar to a train of delta functions, when we convolve it with a decaying exponential signal, we will observe the desired trend, which can be seen on the plot to the lower right.
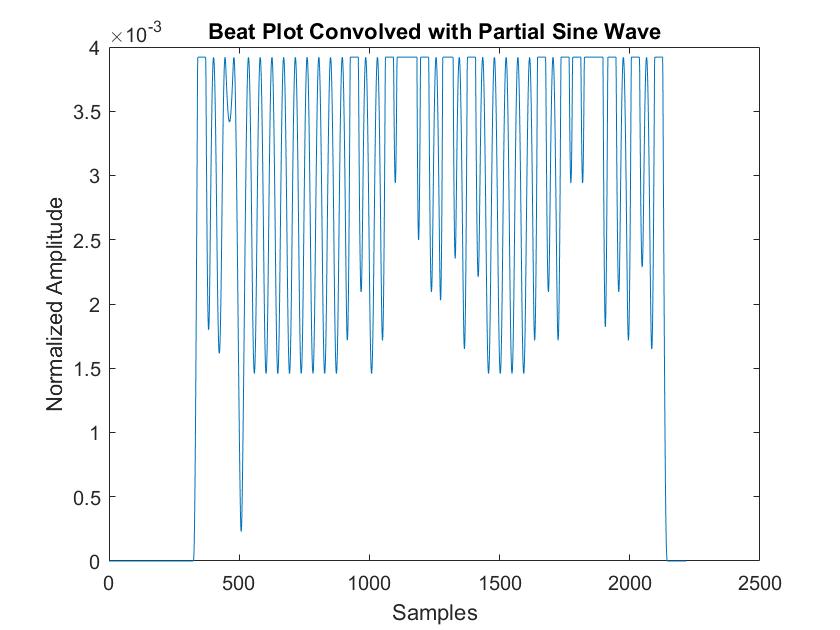
We also temporarily considered instead convolving with a partial sinusoidal wave which produced the plot to the right. While this created a cool effect on the LED strip, we didn't like how the lights were almost anticipating the beats before they happened, so we decided to stay with our method of convolving the novelty curve with a decaying exponential.
|
|
